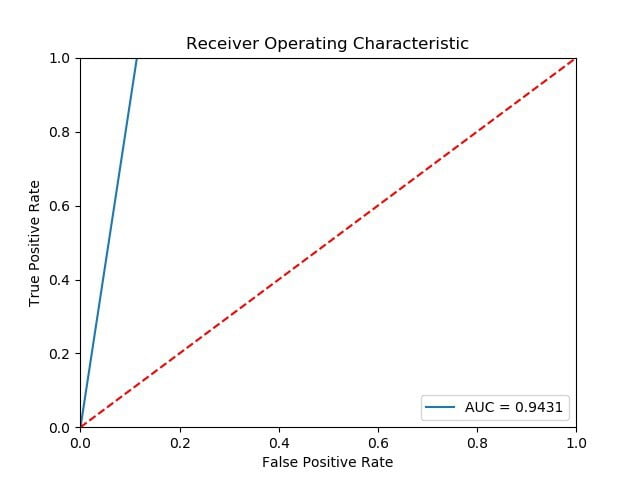
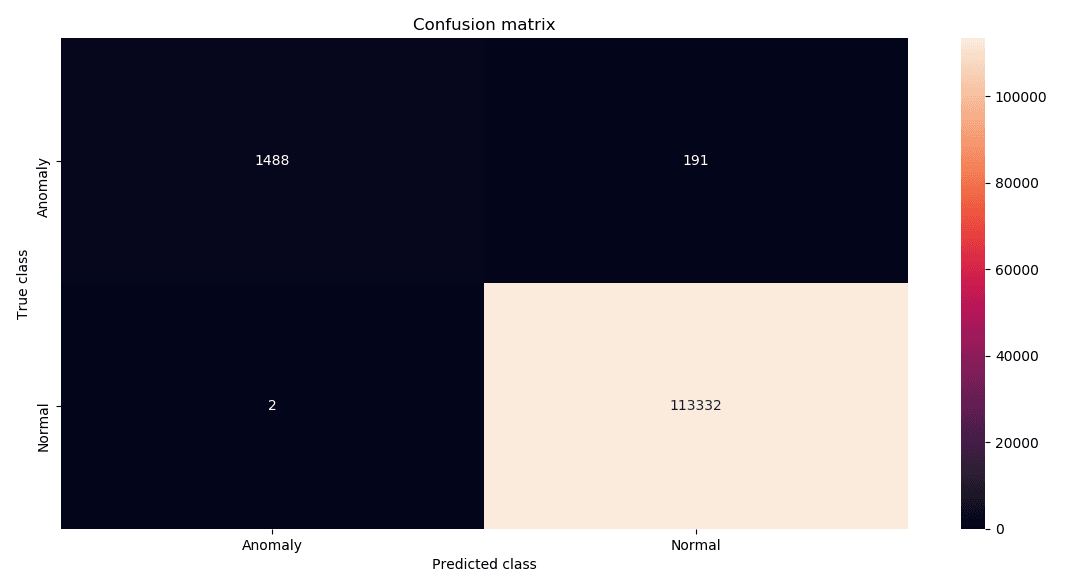
We have a predictive analytics framework to classify whether the sequence of log messages is anomaly or normal. In this, we trained different models and an optimum one is selected based on model validation loss. From Fig-10, it is observed that ROC curve lies in the extreme upper left corner of the diagram and AUC value is 0.94. Also, the confusion matrix is given in Fig-9. The precision, recall and F1 measure values, which are obtained from framework, are 0.99, 0.88, and 0.93 respectively.
Hence, supervised learning model is a better model which can be used for detection of anomalies in the provided log dataset.

Fig-10: Evaluation of the model based on AUC

Fig -11: Confusion matrix